A storm far more intense than the Perfect Storm, of book and movie fame.
One of the most intense landfalling cyclones in several years and perhaps the equal of the great Columbus Day Storm of 1962 that brought 100 mph plus winds to large swaths of the Pacific Northwest.
The storm that will strike the East Coast early next week is eerily like the Columbus Day Storm and the famous Perfect Storm in several ways. Each of these started as a typhoon or hurricane and transitioned into a powerful midlatitude cyclone, undergoing what we call extratropical transition.
As I will describe below, although there is still some uncertainty, the major modeling systems, American and European, have now locked on to a very similar solution.
Hurricane Sandy is now a Category 1 storm with sustained winds about 75 mph and a central pressure of 971 hPa. Now located just north of the Bahamas and still over warm water.
At the same time, an upper level trough is approaching from the west and the interactions between the two will cause Sandy to morph into a hybrid storm, expand, and intensify rapidly. The National Weather Service is doing something very rare: adding more radionsonde (weather balloon) launches (four times a day instead of twice day)...a very wise investment.
This figure shows the situation on Saturday, showing the upper trough over land (red line) and an upper low over Sandy (purple circle) (the figure is for 500 hPa--about 18,000 ft above sea level). These will join up during the next few days.
Sandy will not only grow larger, but the pressure will fall, and the winds will increase. Perhaps the most dramatic description of this process (but not technically quite accurate) was given by a supposed meteorologists in the Perfect Storm movie, click on the picture to view it:
 |
| Click to see video |
But now European Center model has moved northward, the GFS model swings inland earlier, so the differences have diminished.
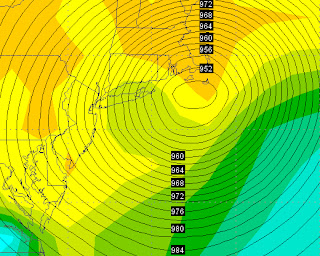
Lets talk a look. First the U.S. GFS. Here is a series of surface pressure analyses from this morning's run (solid line are sea level pressure and shading is relative humidity. A very deep low moves in off the ocean at 8 PM PDT Monday with a pressure of around 950 hPa (the Columbus Day Storm was about 960 hPA), then swings in over Long Island on Tuesday morning, then moves in a circle just inland, and eventually moves northward on Wednesday. This is extraordinary behavior--to have a deep low just circle about for a day, before heading out of the region. And deadly.
The winds would be very strong and damaging...sustained winds of 50-70 knots over the water with higher gusts. Here is the wind forecast at 2 PM on Tuesday morning. Winds are in knots (see legend). Lots of sustained winds above 50 knots over the Atlantic and some coastal locations.
What about the European Center forecasts? A sub-940 hPa low makes landfall on central New Jersey, circles around, and then moves northward. The European Center and GFS models tend to overdo the deepening in this situations, so I don't believe we will see anything below 950-960 hPa.
We are talking about huge events, if either of these forecasts are correct--or if the truth is somewhere in between. Heavy rain, powerful winds over a long period, storm surges north of the low center. This will make the Perfect Storm look like a zephyr. Take a look at the cumulative rainfall through October 31st at 11 PM PDT. 5-10 inches over New Jersey and adjacent areas. And this is a relatively coarse model....could well be more at some locations. Cascade Mountains do almost as well!
Is there still uncertainty now that the major models are converging? You bet. There is some probability that the real storm will moves out to sea. To get a handle on this, lets take a look at the last European ensemble prediction (left panel below) and the their high-resolution forecast (right panel) for 5 AM PDT on Tuesday. The shading is a measure of uncertainty...how much the ensemble members disagree.
The high resolution forecast shows a huge, powerful storm making landfall. Importantly, the ensemble (the mean of many different forecasts) show a low center at a similar position, perhaps a bit farther north. This provides some confidence in the high-res forecast. But the shading shows there is considerable uncertainty still, with the shading offshore suggesting a few of the forecasts were for a low farther offshore. So, this is not 100% now...but a very good bet at this point.
I think you can appreciate the technology...high resolution forecasts show us some possibilities, with ensemble prediction giving us a measure of the uncertainty in the forecasts. No forecast is complete without a quantification of the uncertainty. Nothing is 100%. And certainly not a complex, sensitive situation like this one.


No comments:
Post a Comment